Monitoring CPU and memory usage is essential for managing Linux systems effectively. Linux provides several commands to get a detailed look at resource consumption, helping administrators optimize performance and troubleshoot issues. Here are some essential commands for monitoring CPU and memory usage.
1. Using top Command #
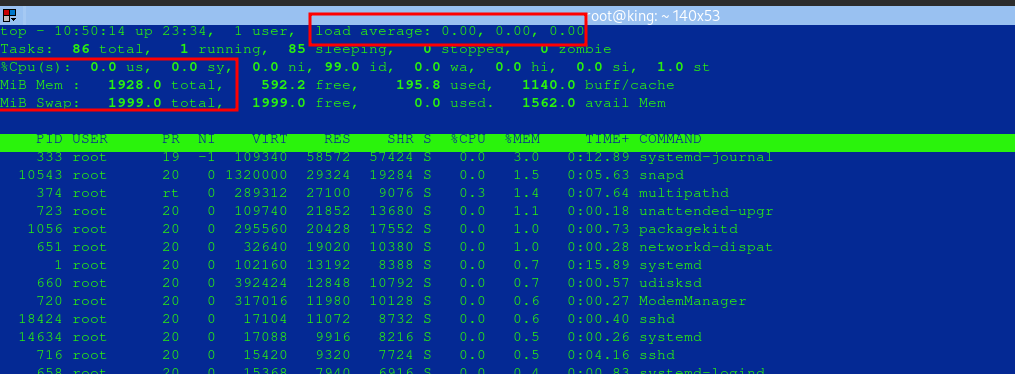
The top command is a popular utility that provides a real-time view of CPU and memory usage.
- To start
top:
top- Key Features:
- Shows CPU, memory, and swap usage.
- Displays a list of processes sorted by CPU usage by default.
- Press
Mto sort by memory usage. You may want to press shift+m
2. Using htop Command #
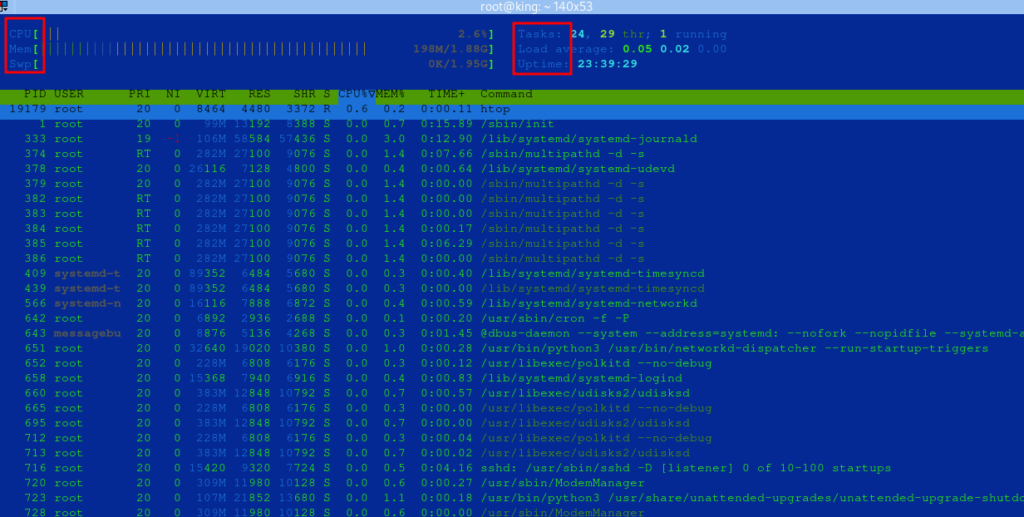
htop is an improved version of top with a more user-friendly interface.
- Install
htop:
sudo apt install htop # Debian/Ubuntu

sudo yum install htop # CentOS/RHEL- Start
htop:
htop- Features:
- Color-coded display for easy reading.
- Ability to scroll vertically and horizontally.
- Interactive interface to kill processes directly from the list.
3. Using vmstat Command #
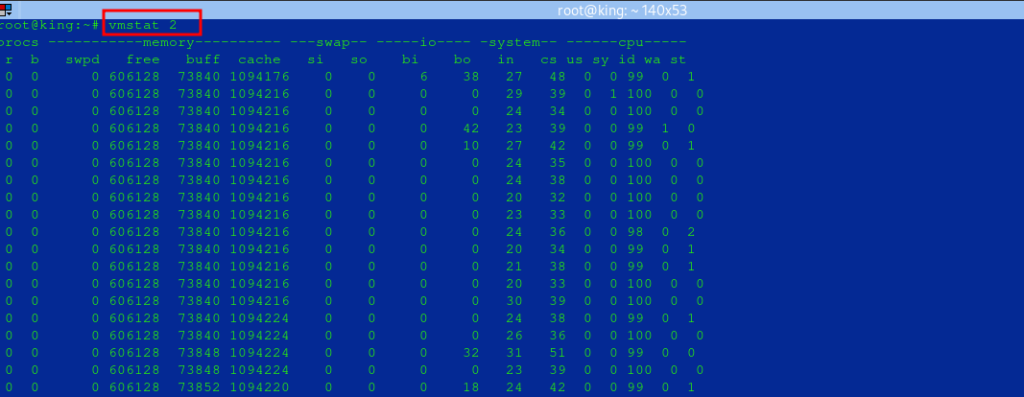
vmstat (Virtual Memory Statistics) reports information about processes, memory, paging, block I/O, and CPU usage.
- Run vmstat with a delay:
- This will refresh every 2 seconds.
vmstat 2- Key Columns:
r: Number of processes waiting for CPU.free: Amount of free memory.siandso: Swap memory in and out.us,sy,id: CPU time for user, system, and idle.
4. Using free Command #
The free command provides a quick overview of system memory usage, showing total, used, and available memory.
- Run
freewith human-readable format:
free -h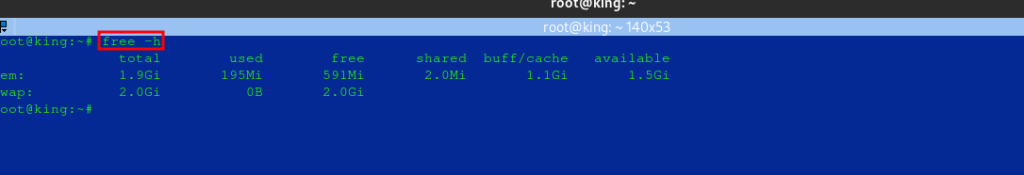
5. Using sar Command
sysstat’s sar command provides historical data on CPU, memory, and other resource usage over time. This is especially useful for identifying trends.
- Install sysstat
sudo apt install sysstat # Debian/Ubuntu
sudo yum install sysstat # CentOS/RHEL- Enable Data Collection:
- The
sysstatservice should be enabled and configured to collect data periodically. - Edit the Configuration File: Open the sysstat configuration file.
- Set
ENABLEDto"true": Change theENABLEDline totrueso thatsysstatcollects and logs system statistics. - Save and close the file.
- Restart the
sysstatService: After enabling data collection, restart thesysstatservice to apply changes.
- The
sudo vi /etc/default/sysstat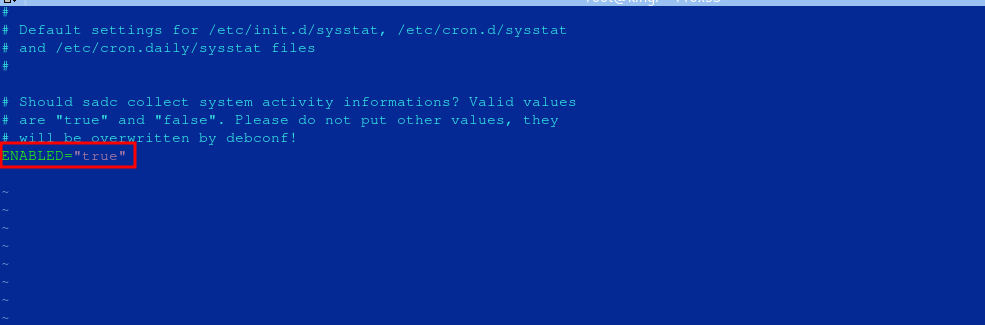
sudo systemctl restart sysstatYou can then check the status
sudo systemctl status sysstat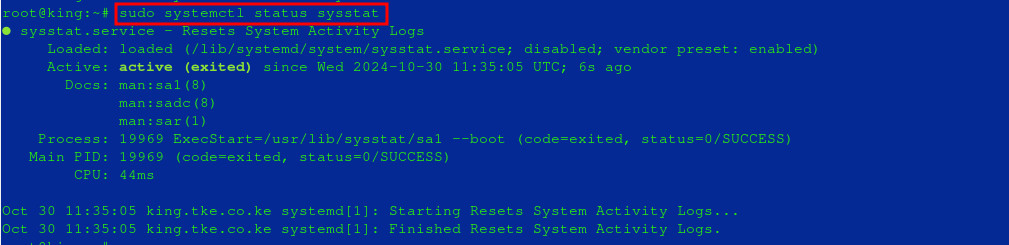
- View CPU Usage over the past intervals:
- This example shows CPU usage at 1-second intervals, 5 times.
sar -u 1 5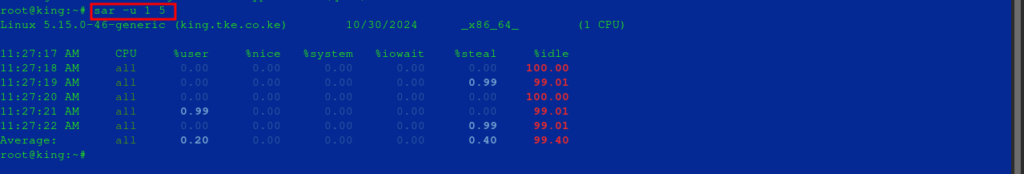
- View Memory Usage:
sar -r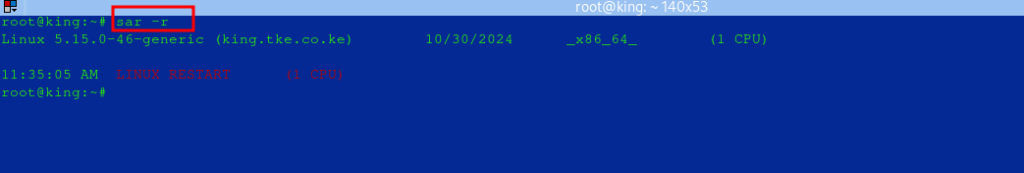
6. Using iostat Command
iostat is useful for monitoring CPU load and input/output (I/O) statistics on disks.
- Install
sysstat(if not already installed):
sudo apt install sysstat # Debian/Ubuntu
sudo yum install sysstat # CentOS/RHEL- Run
iostat:- This command shows CPU statistics at 2-second intervals.
iostat -c 2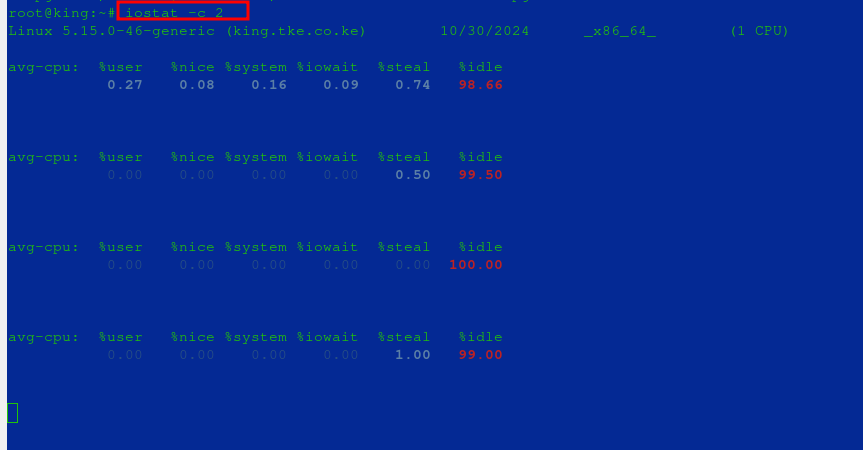
7. Using ps Command
ps (Process Status) displays information about active processes and can be customized to show specific details.
- View Processes by Memory Usage:
ps aux --sort=-%mem | head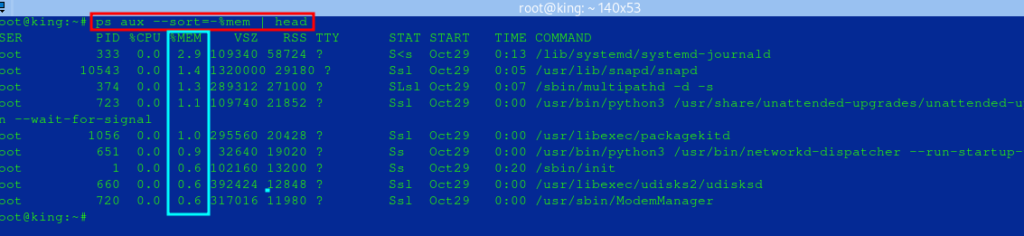
- View Processes by CPU Usage:
ps aux --sort=-%cpu | head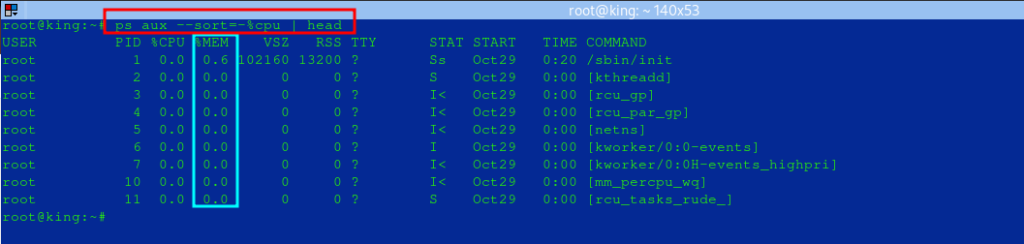
8. Using mpstat Command
mpstat (Multiprocessor Statistics) shows CPU usage per processor, which is valuable for multi-core systems.
- Run
mpstat:- This will show statistics for each core on the system, helping to identify if any single core is overloaded.
mpstat -P ALL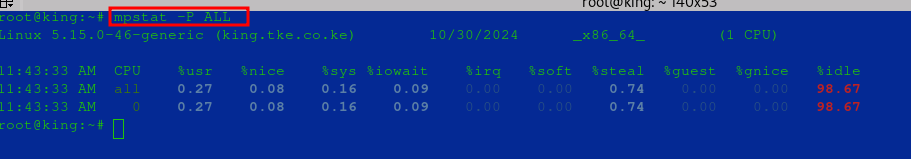
Summary of Commands #
- General Resource Overview:
top,htop - CPU Usage:
top,mpstat,sar -u - Memory Usage:
free,vmstat,sar -r - Disk I/O:
iostat,vmstat
With these commands, Linux administrators have a toolkit for continuous monitoring and diagnostics to manage system resources effectively.


