 Domain RegistrationFind and register the perfect domain for your website.
 .COM DomainChoose a widely recognized domain to build global credibility.
 Domain TransferSeamless domain transfers with zero downtime and complete control.
 All TLDsFind and register your perfect domain. Choose from local and global extensions.
 SSL CertificatesKeep your website safe with reliable SSL Certificates that protect customer data and build trust.
 whoisCheck domain ownership details, expiration dates, and registrar information.
 US DomainRegister a .US domain and build trust in the USA.
 Web HostingEverything your website needs to run smoothly
 WordPress HostingWordPress hosting that just works
 Windows HostingReliable hosting for Windows environments
 Reseller HostingTurn hosting into your business
 Email HostingEmail that looks professional and works anywhere
 cPanel HostingFull control of your hosting with cPanel
 Affiliate ProgramJoin as a partner and earn commissions on every referral you send our way.
 Vps HostingScalable virtual servers that expand as you need.
 Dedicated ServersGet complete access and full control over your dedicated physical server.
 Managed vpsNot tech-savvy? We will take care of everything with our fully managed VPS hosting for you.
 AI Website BuilderCreate stunning websites in seconds with AI.
 Online ShopSet up a professional online store. No coding required.
 Web design serviceGet a tailored website designed to match your brand and support your goals.
 BlogFind helpful guides on web hosting, online selling, digital marketing, and more.
 Contact USYou can reach us anytime, day or night, through chat or email.
 SupportBrowse helpful guides and answers for all of our services.
Google Trends can help you reject a weak product idea before you spend money on samples, inventory or ads. It shows whether search interest is rising, falling or seasonal; where a term is relatively popular; and which related searches are growing.
It cannot tell you how many units will sell, what customers will pay or whether the margins work. Treat it as a demand signal, not a sales forecast.
This guide uses a live test of air fryer, walking pad and standing desk in the United States over five years. You can repeat the same process with products in your market.
What Google Trends can tell you about a product
Google Trends uses a sample of Google searches, then normalizes the data for the selected place and period. Each point is scaled from 0 to 100. A score of 100 marks the peak relative interest in that result set; it does not mean 100 searches or 100 percent of shoppers.
Google’s explanation of Trends data also notes that low-volume terms may appear as 0, repeated searches from one person over a short period are removed, and statistical noise can create small fluctuations.
That is why a single spike should never decide what you stock.
Signal | Useful question | What it does not prove |
|---|---|---|
Interest over time | Is attention growing, stable, declining or seasonal? | Monthly search volume or future sales |
Comparison | Which candidate has stronger relative interest in the same market and period? | Profitability |
Interest by subregion | Where is the term a larger share of local searches? | Which region has the most buyers in absolute numbers |
Related queries | Which brands, features and use cases are appearing around the product? | Purchase intent for every query |
Web, Shopping or YouTube Search | Where does the interest show up? | Conversion rate on your store |
The distinction between relative interest and absolute demand is the most important part of using Google Trends for product research.
Run a 15-minute product screen
Start with three to five products that solve a similar problem or compete for the same budget.
Comparing an air fryer with a standing desk can demonstrate the controls, as this test does, but a real buying decision should compare closer substitutes such as walking pad, under desk treadmill and folding treadmill.
1) Open Explore and choose the available interface
Open Google Trends Explore. As of July 20, 2026, a signed-out visitor sees a prompt to sign in for the new Explore page and its Gemini features. The same screen offers Remain on Classic Explore, which still works without signing in.
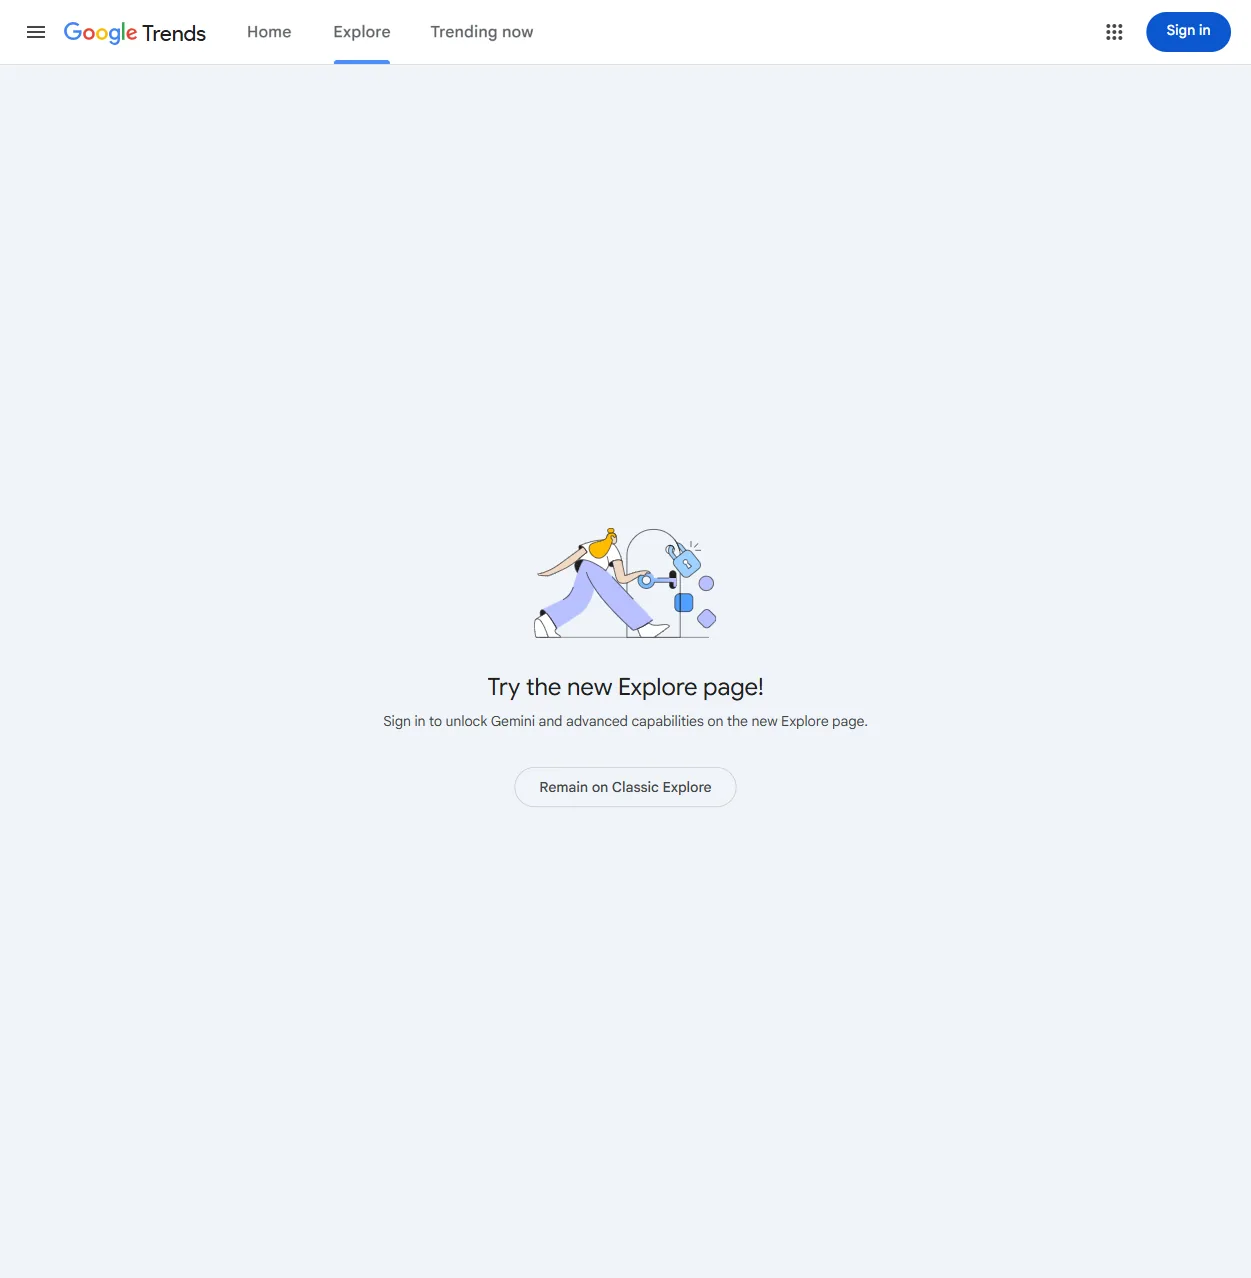
Google Trends interface captured July 20, 2026. Data source: Google Trends.
Use Classic Explore if you want the established comparison workflow without connecting a Google account. The controls described below are based on that interface.
2) Choose a search term or a topic deliberately
Type the first product into Add a search term. Google may offer the literal search term, a broader topic or named products.
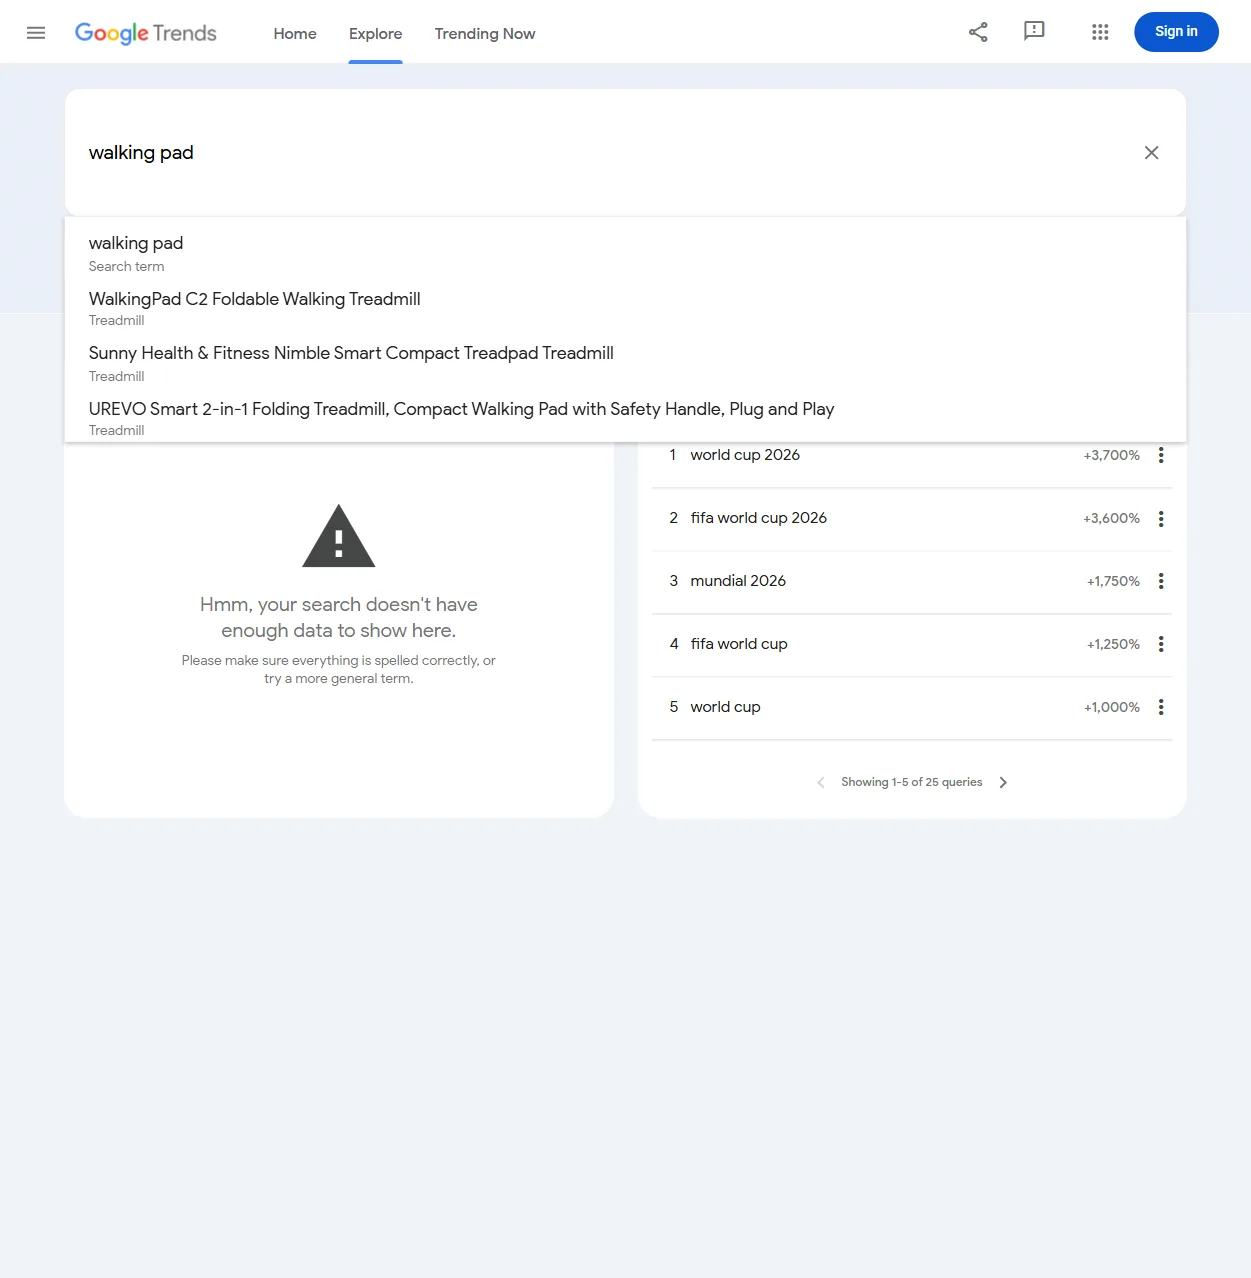
The walking pad test showed a broad search term plus specific treadmill products. Captured July 20, 2026. Data source: Google Trends.
A search term matches searches containing those words in the selected language. A topic groups the same concept across languages and related wording. Google’s term and topic comparison guide explains that Trends does not automatically combine every misspelling, synonym, singular and plural form for a search term.
Use the same type for every candidate when possible. Comparing one broad topic with one narrow product term can make the broader item look stronger simply because it includes more ways of searching.
3) Lock the geography, time range, category and search type
Add the remaining candidates, then set all four filters before reading the charts:
Geography: Choose the country or region where you can sell and deliver.
Time: Start with five years to expose direction and seasonality. Use 12 months later for launch timing.
Category: Keep All categories unless the wording is ambiguous. A term such as
jaguarneeds a category to separate the animal from the car brand.Search type: Start with Web Search, then repeat the test with Google Shopping when the product has clear retail intent.
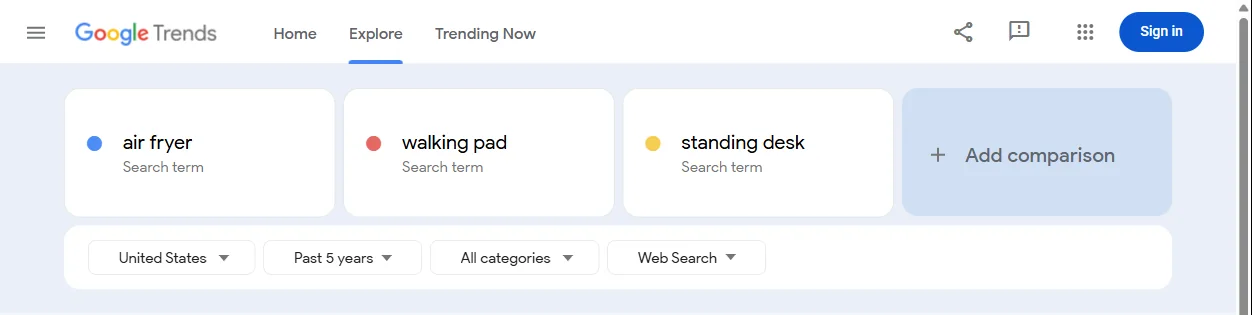
Test settings: United States, past five years, all categories and Web Search. Captured July 20, 2026. Data source: Google Trends.
Do not change the geography or time range between candidates. The numbers are normalized inside the active comparison, so a score from one screen cannot be pasted beside a score from another and treated as equivalent.
4) Read the shape of interest, not just the highest line
Use Interest over time to classify each candidate:
Stable: Demand holds within a consistent band. This may suit an evergreen catalogue.
Growing: The baseline rises across several periods, not just one week.
Seasonal: Peaks repeat at similar times each year. This can be attractive if you can order, publish and advertise before the peak.
Fading: Each major peak or baseline is lower than the last.
Event-driven: One sharp spike follows a news event, viral video or temporary shortage.
Change from five years to 12 months only after you understand the long pattern. A 90-day rise can look exciting while hiding four years of decline.
The test session for this guide loaded filters, subregion data and related queries, but Google’s interest-over-time endpoint intermittently returned Oops! Something went wrong after repeated automated requests. That failure is not evidence about the products. If a chart fails, wait, refresh once in a normal browser and avoid rapid repeated queries.
5) Check whether the product is seasonal
Look for peaks at roughly the same point each year. Then identify when interest begins to rise, not only when it reaches 100.
If searches for a product start climbing six weeks before a holiday, your useful deadline is earlier. You still need time for supplier checks, shipping, product photography, landing pages and ad testing.
Compare the same months across several years. One peak can be an accident; a repeated pattern is a planning signal.
6) Use subregions to find where the wording is strongest
The comparison-by-subregion panel shows the share of searches represented by each term in a state or region. It does not show absolute buyer counts.
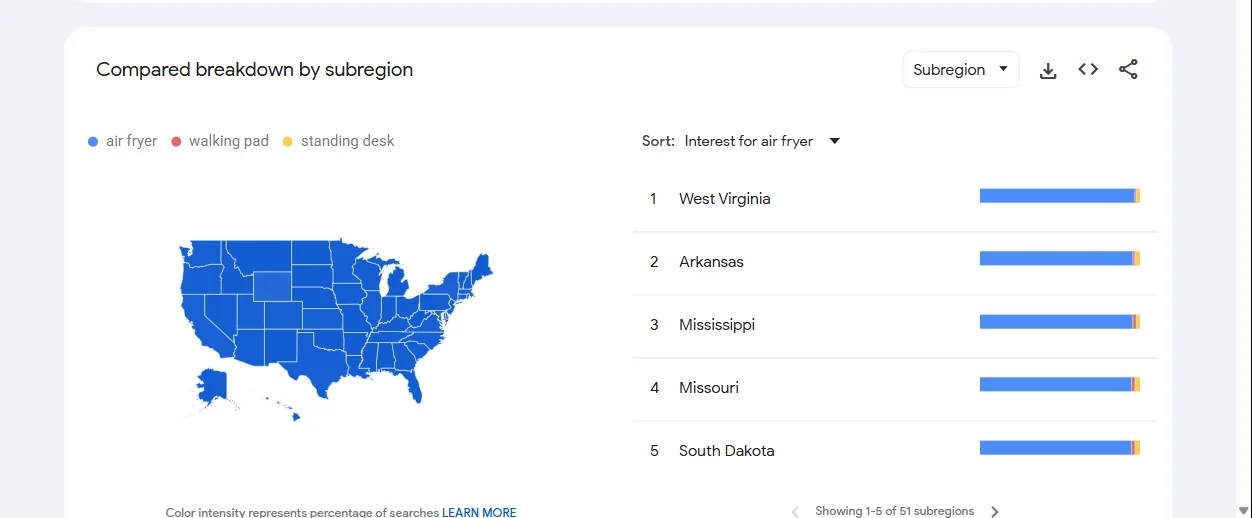
The live comparison was sorted by interest for air fryer; West Virginia, Arkansas, Mississippi, Missouri and South Dakota appeared first in the visible list. Captured July 20, 2026. Data source: Google Trends.
Use this panel to decide where to run a small regional test or which language to use on a landing page. Before committing budget, compare the signal with population, shipping cost, marketplace activity and your own customer data.
7) Turn related queries into research leads
At the bottom of the page, switch Related queries between Top and Rising.
Top shows queries most frequently searched with your term in the selected context.
Rising shows queries with the strongest growth against the preceding period.
Breakout means the query grew by more than 5,000 percent, according to Google’s related-search documentation.
The walking-pad test returned five visible rising brand-led queries. All were marked Breakout.
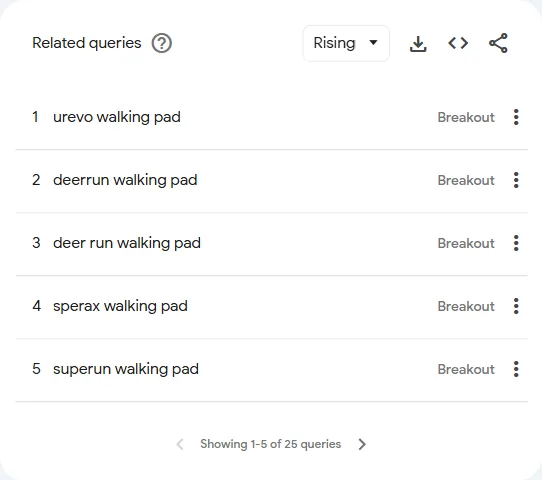
Rising related queries for walking pad, United States, past five years. Captured July 20, 2026. Data source: Google Trends.
The standing-desk panel also connected the category back to walking pads. It showed flexispot e7, best standing desk 2022 and walking pad as Breakout; deskhaus at +2,200 percent; and branch standing desk at +900 percent.
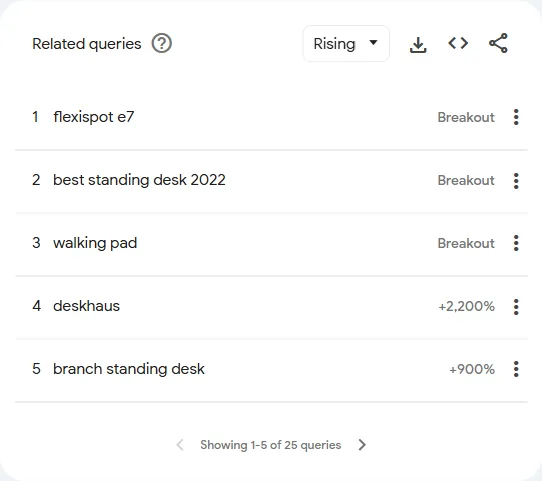
Rising related queries for standing desk, United States, past five years. Captured July 20, 2026. Data source: Google Trends.
These results are leads, not a ready-made product list. A brand query may reflect reviews, complaints, recalls or existing customer support. Open the search results, inspect current products and check marketplace evidence before treating it as demand you can serve.
What the live test says about walking pads
The test does not prove that a walking pad will outsell an air fryer or standing desk. The interest-over-time chart did not load reliably in the automated session, and Google Trends does not publish unit sales.
It does support three narrower conclusions:
Walking padis established enough to return U.S. regional and related-query data.Several brand-specific walking-pad searches were Breakout queries in the selected five-year comparison.
Walking padalso appeared as a Breakout query related tostanding desk, suggesting overlap between the two product conversations.
That is enough to move the idea into a second research round. It is not enough to buy inventory.
The next round should compare close alternatives, check Google Shopping, investigate the named brands, estimate delivered cost and returns, and test whether shoppers respond to a specific offer.
Score the signal before you keep the product
Use a simple 0-to-2 score for each product. The score forces you to record why an idea moves forward.
Test | 0 points | 1 point | 2 points |
|---|---|---|---|
Five-year direction | Clear decline | Flat or unclear | Rising baseline |
Seasonality | One-off spike | Seasonal but predictable | Stable or repeatable growth |
Regional fit | Weak in serviceable markets | Mixed | Strong in markets you can serve |
Related-query quality | Irrelevant or news-led | Some useful features or brands | Several relevant rising use cases |
Shopping confirmation | Little retail evidence | Mixed evidence | Consistent marketplace and shopping demand |
Unit economics | Margin fails | Needs negotiation | Margin survives product, delivery, returns and ads |
A high Trends score cannot rescue bad unit economics. A modest Trends score may still support a profitable niche if the customers are valuable and competition is weak.
Confirm demand outside Google Trends
Google Trends should narrow the list. Other evidence should decide whether you test the offer.
Get an absolute-volume estimate
Use Google Keyword Planner or another keyword tool to estimate monthly searches. Trends and Google Ads are different data sources, so do not combine their figures as if they use one scale. Google’s export and citation guidance makes that distinction explicit.
Check marketplace behaviour
Search Amazon, Walmart, Etsy or the marketplace that fits the product. Look for:
several sellers with recent reviews, not one viral listing;
recurring complaints you could solve;
price bands and discount dependence;
obvious brand dominance;
replacement, refill or accessory demand; and
signs that returns may be expensive.
Marketplace rank and review count are imperfect, but they add commercial context that Trends cannot provide.
Calculate the delivered margin
Include the product cost, inbound freight, duties, storage, payment fees, packaging, last-mile delivery, expected returns, support and customer acquisition.
A product with growing searches can still be a poor business if it is fragile, regulated, easy to return or expensive to advertise.
Test a specific offer before stocking deeply
Build a focused product page, collect wait-list signups, run a small ad test or accept preorders only when you can state delivery terms honestly. Measure clicks, qualified leads, completed checkouts and refund requests.
If the evidence survives that stage, you can launch an online shop with Truehost and keep the first catalogue small. Research should reduce the risk of the launch, not delay it forever.
For the broader setup sequence, see how to start an ecommerce business. If you are still choosing a business model, compare the most profitable online business ideas in the USA before you commit to inventory.
Avoid the seven most common Google Trends mistakes
Treating 100 as search volume
The scale is relative. Use a volume tool for approximate search counts.
Comparing products that do not share a decision
Use broad comparisons to orient yourself, then compare close substitutes. The second comparison is the one that helps you choose.
Mixing terms and topics carelessly
Record whether each candidate is a term or topic. Keep the scope consistent.
Calling every Breakout query a product opportunity
Breakout describes growth from the prior period. A tiny or new query can grow by more than 5,000 percent and still have limited demand.
Ignoring the selected market
Worldwide interest does not help if you can sell only in one country. Start with the market your payments, delivery and support can serve.
Chasing the peak instead of preparing for it
For seasonal products, the order date and campaign date come before the search peak.
Using Google Trends as the final verdict
Google itself says Trends is not a scientific poll and should be treated as one data point. Pair it with volume, marketplace, customer and financial evidence.
When Google Trends shows no data or a rate-limit error
Try these fixes in order:
Check the spelling and select a broader search term.
Expand the geography or time range.
Remove quotation marks or overly specific model numbers.
Try a broader topic when Google offers one.
Reduce the number of comparison terms.
Refresh once, then wait if the page shows a 429 or repeated error panels.
Use a normal browser session instead of sending rapid automated requests.
A missing chart does not prove zero demand. Google suppresses some low-volume data, and temporary request limits can block an otherwise valid query.
Keep a one-page decision record
Save the Trends link or export the chart as CSV, then record:
product and exact query;
term or topic;
country, period, category and search type;
long-term direction;
seasonal months;
strongest serviceable regions;
top and rising related queries;
absolute-volume source;
marketplace evidence;
delivered margin;
next test; and
decision: reject, watch or test.
Google Trends is most useful when it removes ideas from your list. The product that remains still has to survive customer, supplier and margin checks. When it does, launch the smallest credible offer and let real behaviour provide the next answer.